
Tableau Overview
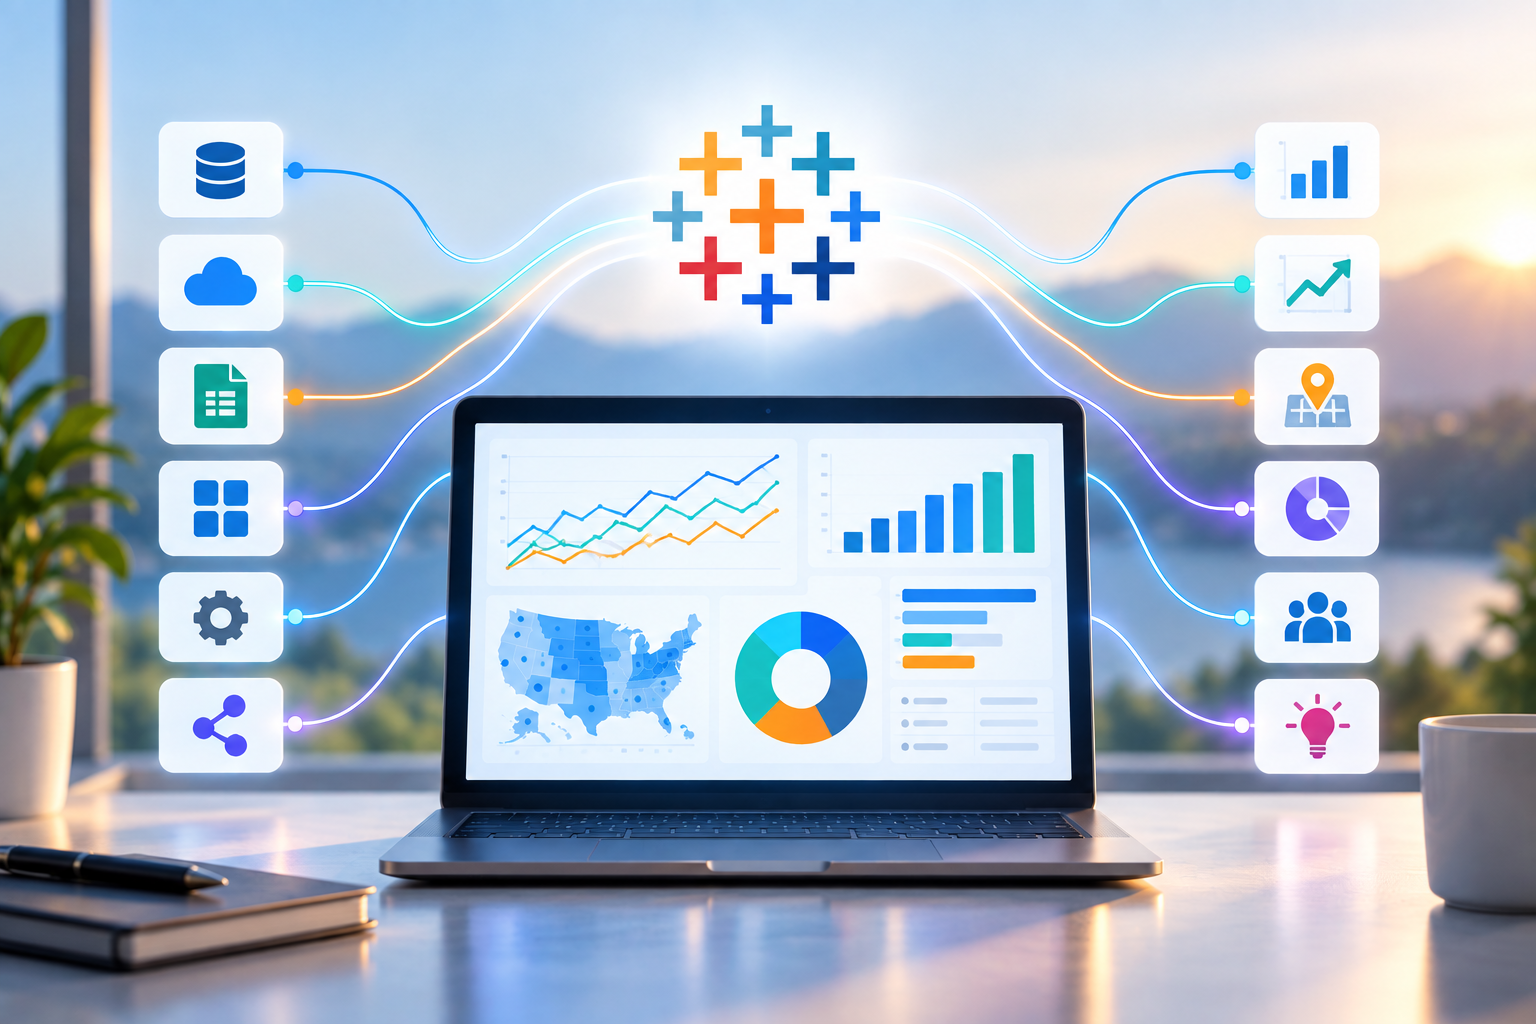
Tableau is a data visualization and business intelligence platform that turns complex information into interactive dashboards, charts, graphs, maps, and other visual experiences.
Instead of requiring people to interpret large spreadsheets, database tables, or disconnected reports, Tableau makes information easier to explore and understand. Users can quickly see trends, compare performance, investigate changes, and drill deeper into the information behind the numbers.
Tableau can connect to a wide range of data sources, including databases, spreadsheets, cloud platforms, data warehouses, and other business systems, bringing information together into visual experiences designed around the questions an organization needs to answer.
For AspirationalX, effective data visualization is about more than making data look good. A useful dashboard needs the right underlying data, meaningful metrics, thoughtful organization, and a clear understanding of the decisions people are trying to make.
We use Tableau to bridge the gap between complex data and the people who need to understand it, creating accessible tools that turn information into insight and insight into action.
Typical Use Cases for Tableau
- Executive dashboards — Give leadership a clear view of organizational performance, priorities, trends, and key metrics.
- Business intelligence and reporting — Transform recurring reports and complex datasets into interactive, easier-to-understand visualizations.
- Operational dashboards — Monitor day-to-day performance, workloads, activity, service levels, and operational health.
- KPI and performance tracking — Create centralized views of the metrics that matter most to teams and organizations.
- Data exploration — Allow users to filter, compare, drill down, and investigate information without manually rebuilding reports.
- Trend and pattern identification — Surface changes, relationships, anomalies, and opportunities that can be difficult to recognize in raw data.
- Geospatial visualization — Use maps and location-based data to understand geographic patterns, activity, risk, and performance.
- Financial analysis — Visualize revenue, expenses, forecasts, budgets, variances, and other financial information.
- Sales and customer analytics — Explore customer behavior, sales performance, pipeline activity, retention, and market trends.
- Data consolidation — Bring information from multiple systems or sources into a more unified reporting experience.
- Self-service analytics — Give business users greater ability to answer questions and explore trusted information independently.
- Real-time and recurring reporting — Replace static reporting processes with dashboards that can refresh as new information becomes available.
Our Expertise with Tableau
AspirationalX approaches Tableau from both sides of the visualization: what the user needs to see and what has to happen behind the scenes to make that information accurate, reliable, and useful.
Our experience spans data visualization, analytic application development, data engineering, cloud infrastructure, databases, data warehouses, ETL pipelines, APIs, and large-scale analytics.
That allows us to work beyond the dashboard itself.
We can help organizations identify meaningful metrics, connect and prepare data sources, structure information for analysis, design intuitive visualizations, improve reporting workflows, and build the underlying data processes needed to keep dashboards current and trustworthy.
Our broader experience with technologies such as Databricks, Apache Spark, Apache Airflow, BigQuery, AWS, Google Cloud Platform, and cloud data warehouses also helps us integrate Tableau into larger data environments rather than treating visualization as a standalone project.
Most importantly, we design around the people using the information.
A dashboard filled with charts is only valuable if someone can understand what they are seeing and use it to answer a question. We focus on creating visualizations that provide the right level of detail, make important information easier to recognize, and allow users to move naturally from a high-level view into deeper analysis.
The goal is simple: make complex data easier to see, easier to understand, and easier to act on.
Case Studies Featuring Tableau & Data Visualization
- Building a Scalable RTB Bidder for Digital Advertising
- Developing an Advanced Analytics Application for a U.S. Government Client
- High-Volume Real-Time Data Processing and Analytics System
- Media Arbitrage with RTB Adapters for Ad Networks and Exchanges
- Enhancing Utility Pole Maintenance with Advanced Data Analytics
- Principal Component Analysis of Mobile Ad Engagement at Scale
- Big Data Exchange (BDEX) Customer Revisit Likelihood Scoring Algorithm Leveraging Location Data
- Optimizing a Big Data ETL Pipeline with Alteryx and Apache Spark on Databricks